Open Source Point of Sale has a number of different types of reports built into the system, such as:
Graphical Reports
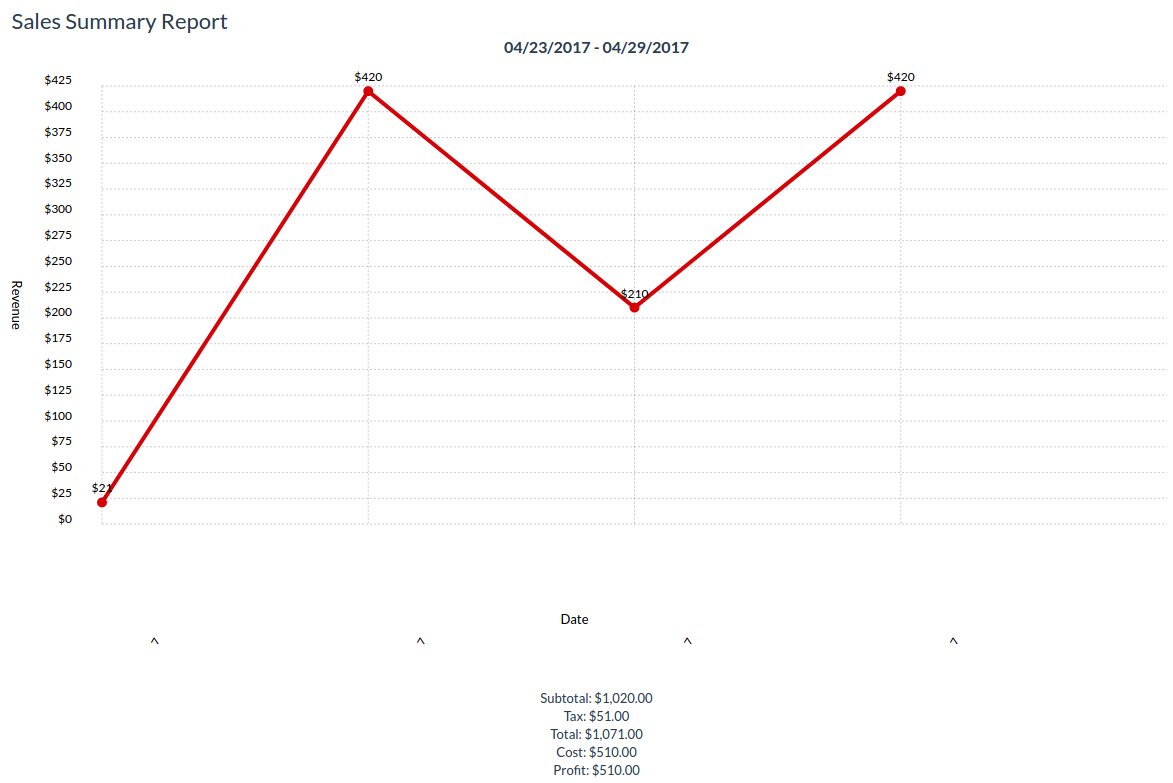
There are Graphical Reports for:
- Sales
- Categories
- Customers
- Suppliers
- Items
- Employees
- Taxes
- Discounts
- Payments
Using these reports, you can get a complete overview of your retail business quickly.
You can drill down by Date Range, Sale Type and Stock Location if you need a different view of the data.
Summary Reports
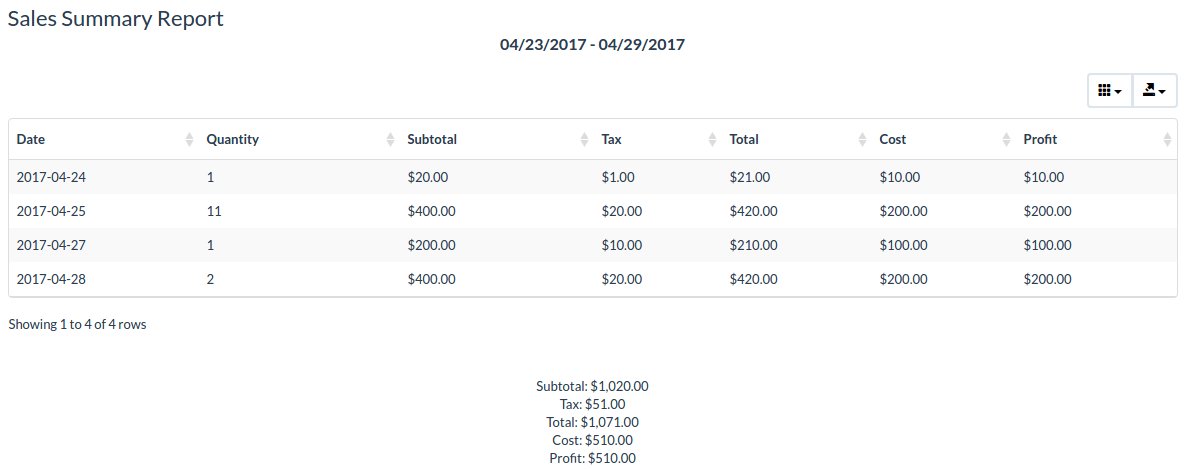
These reports show you a summary of the data in tabular format.
There are Summary Reports for:
- Sales
- Categories
- Customers
- Suppliers
- Items
- Employees
- Taxes
- Discounts
- Payments
You can edit the Date Range, Sale Type and Stock Location to restrict the data set. You can also export the information to Excel or sort it right in OSPOS.
Detailed Reports
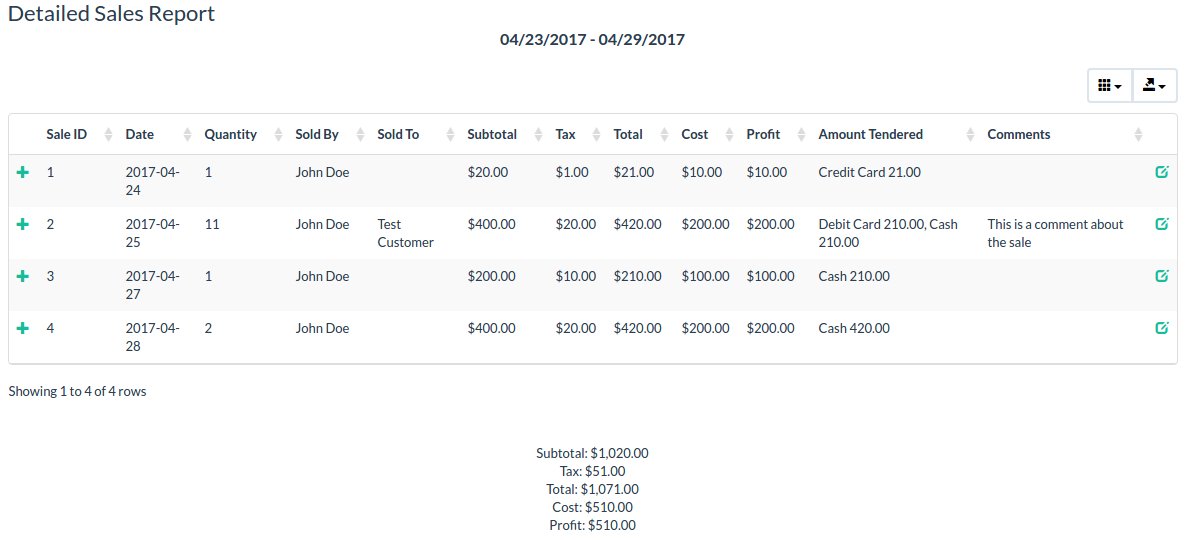
Detailed Reports give you very detailed information on the topic.
There are Detailed Reports for:
- Sales
- Receivings
- Customer
- Employee
- Discounts
Again, you can restrict the data set by Date Range, Sale Type and Stock Location.
You can also export the information to Excel or sort it right in OSPOS.