There are several types of reports built into Open Source Point of Sale. These can help you learn more about how your business is doing.
Start by clicking on the Reports tab in the OSPOS header.

This will load the Reports page. From here, you can run the different reports available.
There are two main types of reports built into the system: Summary and Detailed.
Summary Reports give you an overview of how a part of your business is doing in either a graphical or a tabular format.
Detailed Reports give you a list of every transaction. This lets you really drill down into the specifics of your business.
As a business owner or manager, you're probably most interested in your sales. Let's start by running off some Sales Reports.
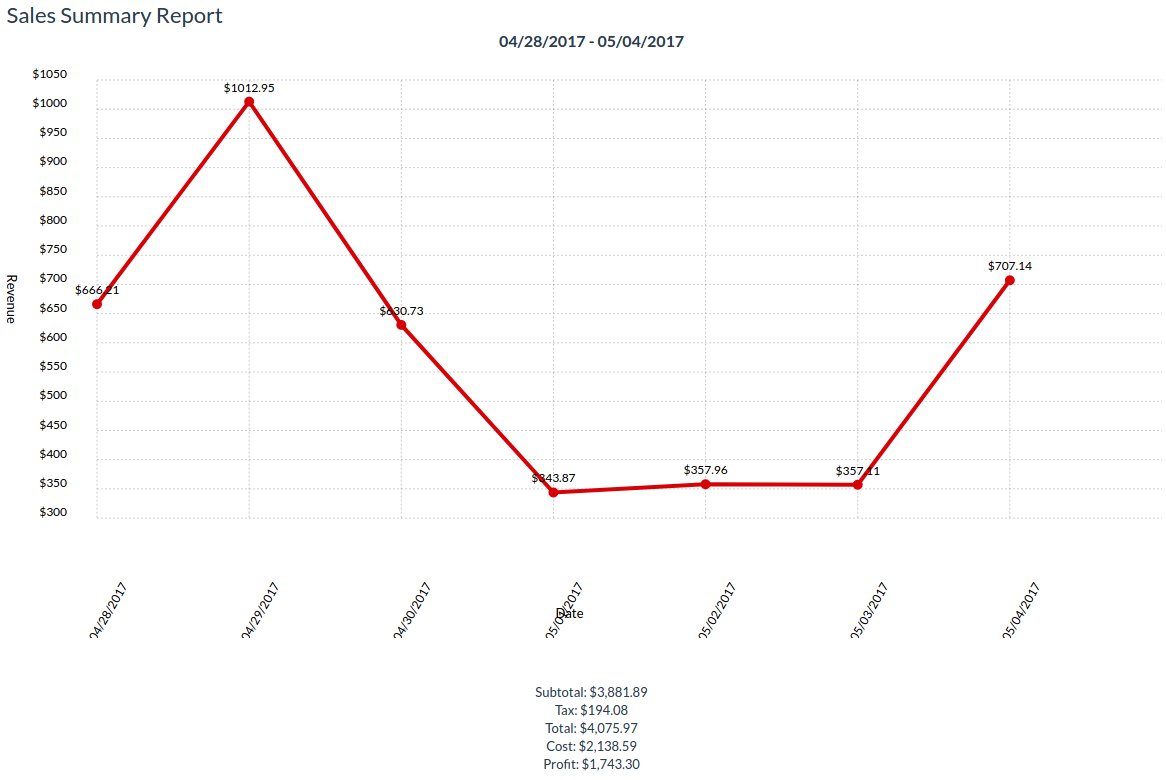
Start by running off a Graphical Sales Report. Look under Graphical Reports for Sale, and click on that. This will load the Report Input page.
These controls let you filter the report by date range, sale type, and stock location. Select a date range. In this example, we're going to choose Last 7 Days.
You can leave Sale Type and Stock Location as All. Click the Submit button to run the report.
A line chart will be generated with Revenue on one axis and Date on the other.
To get the same data in a tabular format, click the Reports tab in the header to get back to the Reports page.
Under Summary Reports, click on Sale. This will load the Report Input page, where you can filter the report. This page is the same as the one you saw earlier.
Again, select Last 7 Days as the date range, so it will match the data from the graphical report. Then click the Submit button.
This generates the tabular Sales Summary Report.
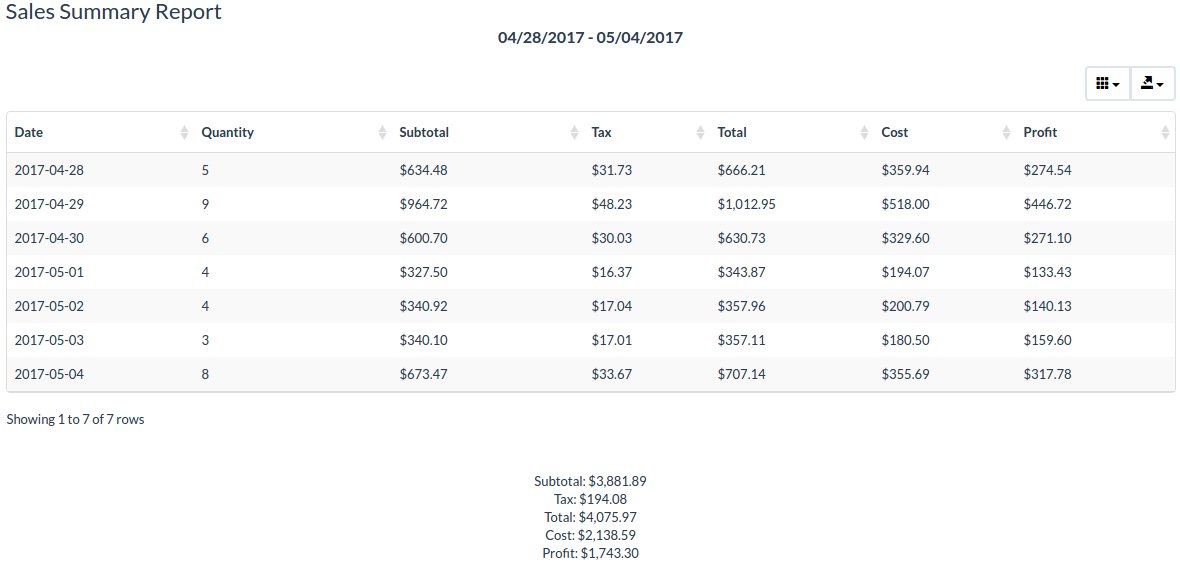
You can sort the data by clicking on the headings. You can export this data as well if you want to analyze it in another program.
Finally, you can also run off a Detailed Sales Report. Click on the Reports tab in the header again to get back to the Reports page. Look under Detailed Reports, and click on Sale.
This will once again load the Report Input page where you can filter the report. We're going to choose a day a few days ago, because we're interested in the sales for that day.
Click the Submit button to generate the report.
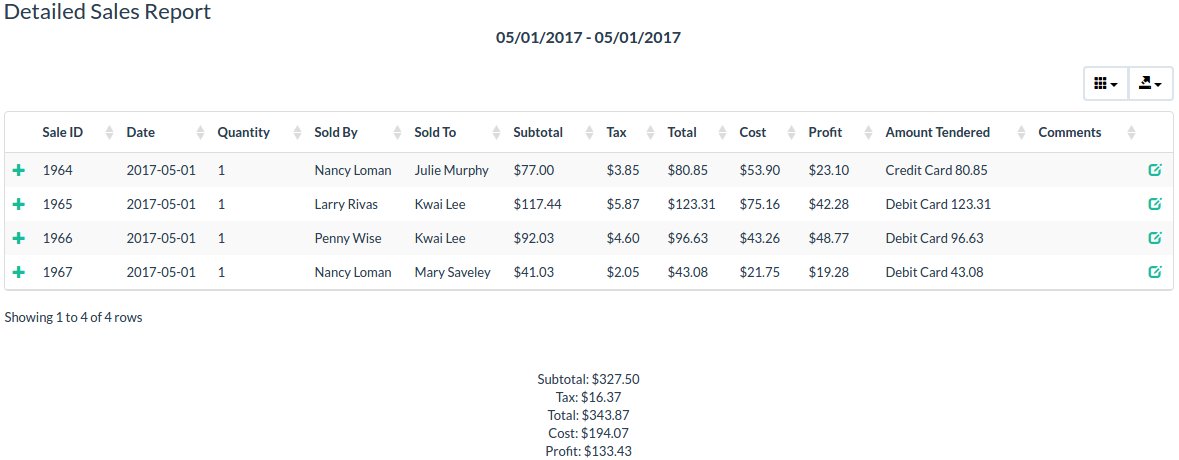
You can sort this report by clicking on the headings. You can also export the data to another program if you want to analyze it there.
Click the "+" to see more information about that sale. You can also click the update button at the end of the row to update or delete the sale.