Open Source Point of Sale's graphical reports give you a snapshot of different areas of your business. They let you quickly see how you're doing.
Sales Report
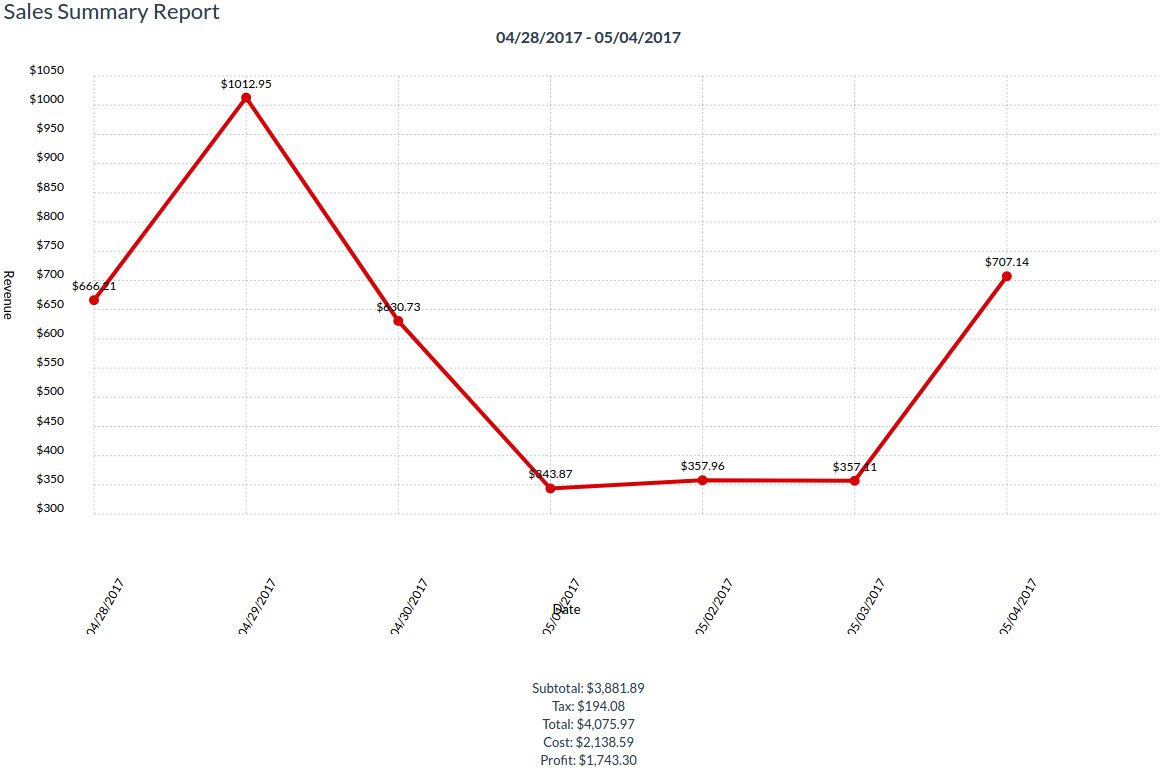
The Graphical Sales Report gives you a line chart of sales totals for a specified period of time.
Categories Report
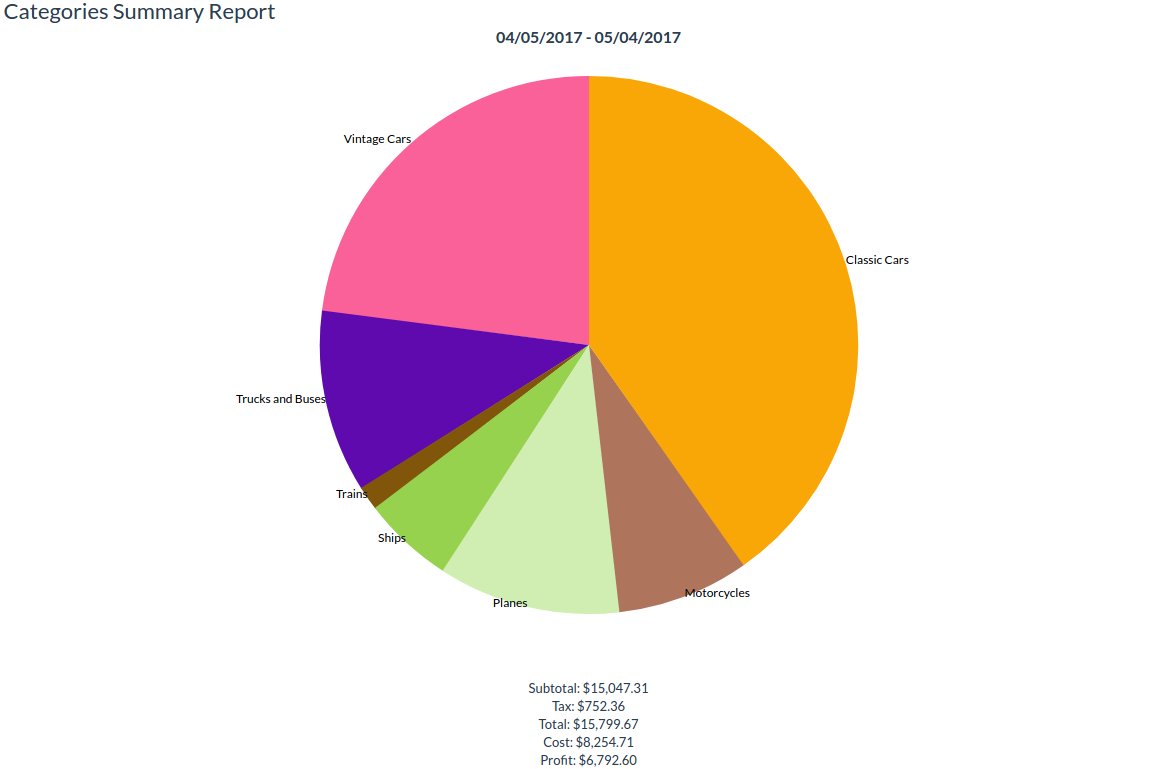
The Graphical Categories Report gives you a pie chart of percentage of sales by category. This lets you see which categories of products are selling and which aren't.
Customers Report
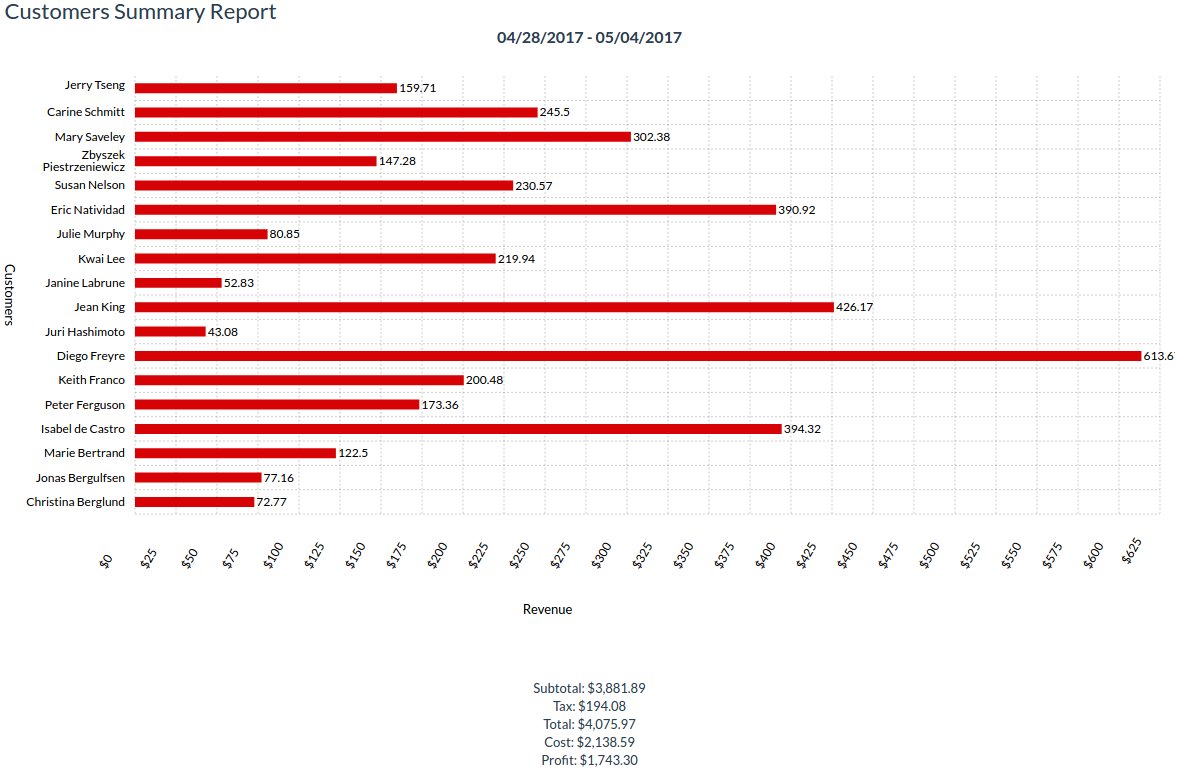
The Graphical Customers Report gives you a bar chart of revenue per customer. This lets you see at a glance which customers are the most valuable.
Suppliers Report
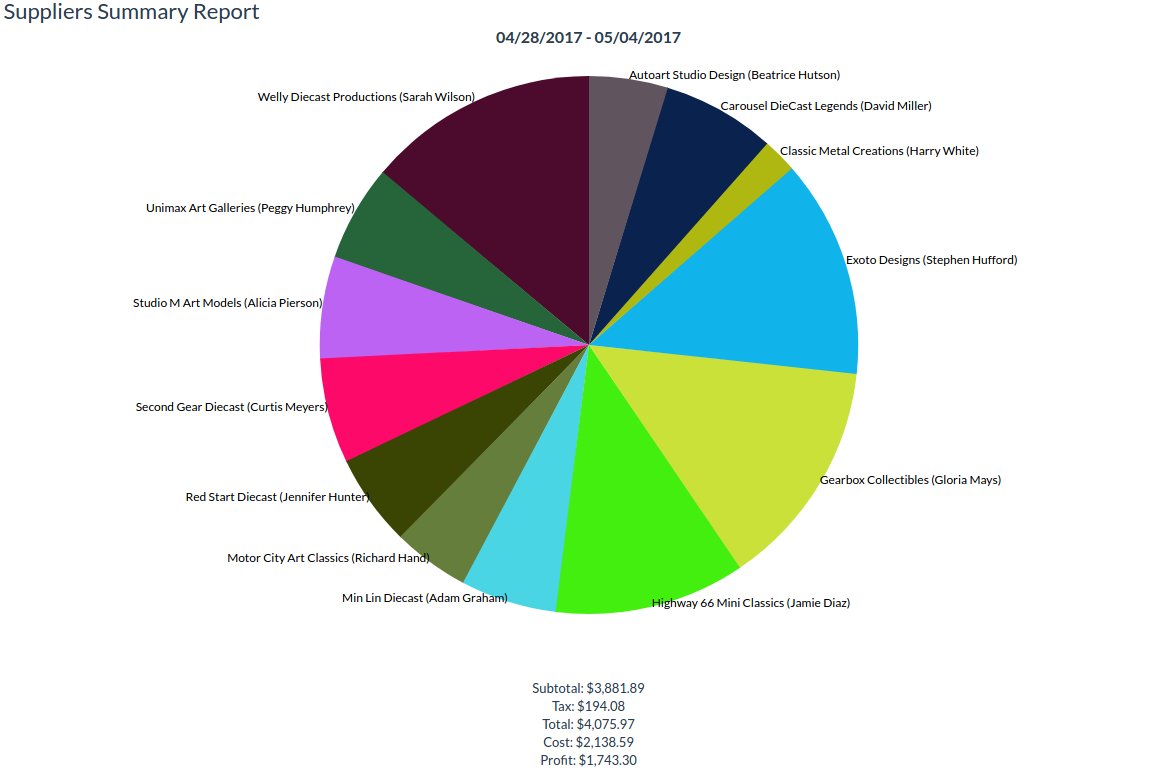
The Graphical Suppliers Report gives you a pie chart of percentage of sales by supplier. This lets you see which suppliers' products are selling and which aren't. Useful information to have when you're deciding what to re-order.
Inventory Items Report
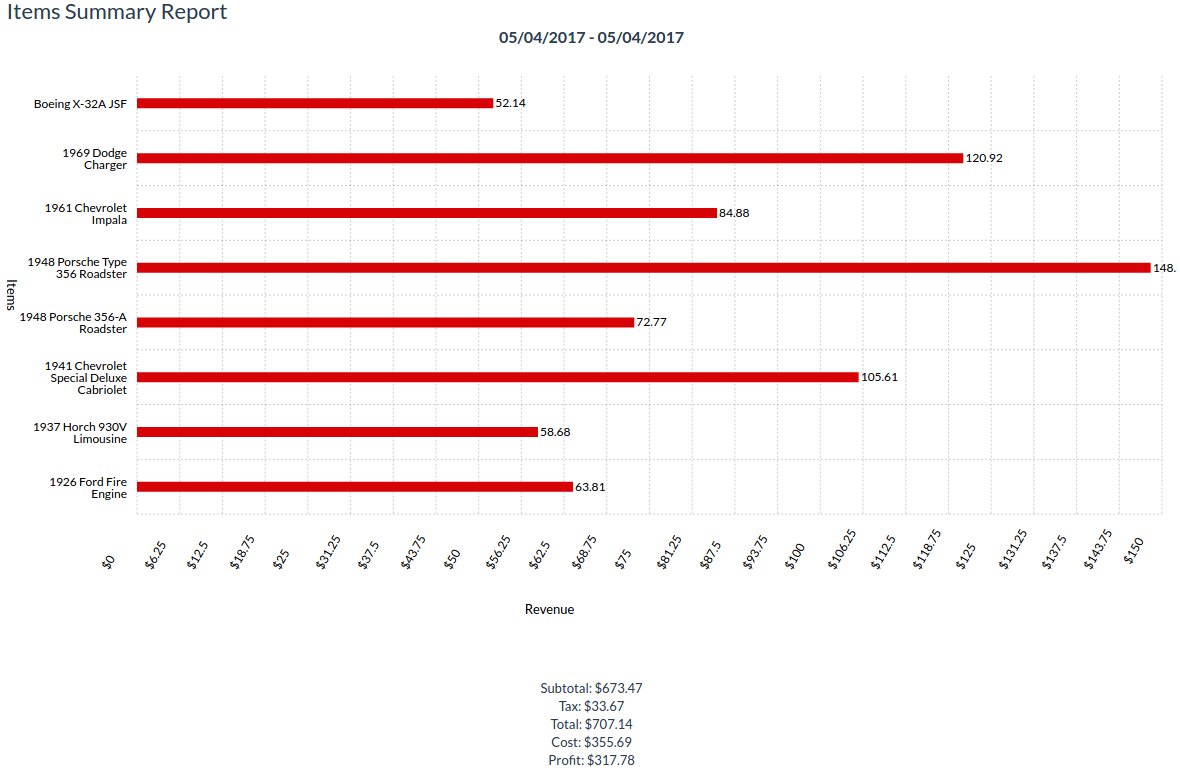
The Graphical Items Report gives you a bar chart of revenue by inventory item. This lets you see what your best sellers are at a glance.
Employees Report
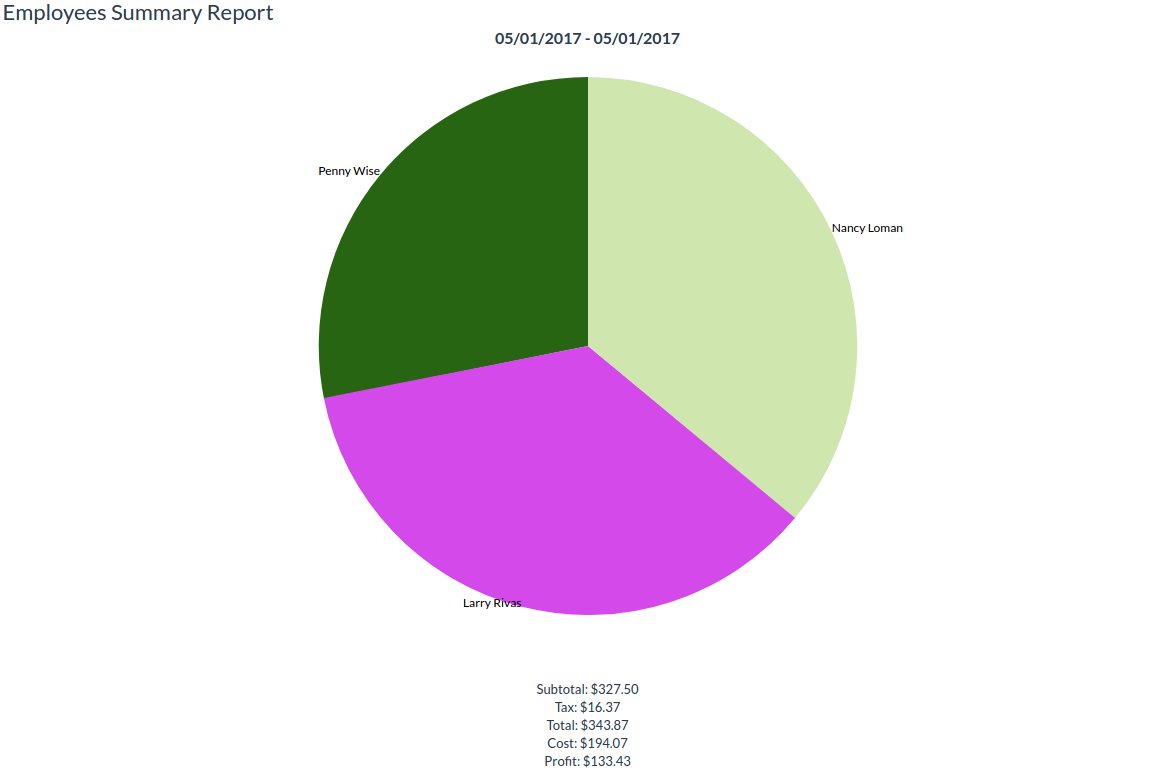
The Graphical Employees Report gives you a pie chart of sales by employee. This lets you see which employees are your best.
Taxes Report
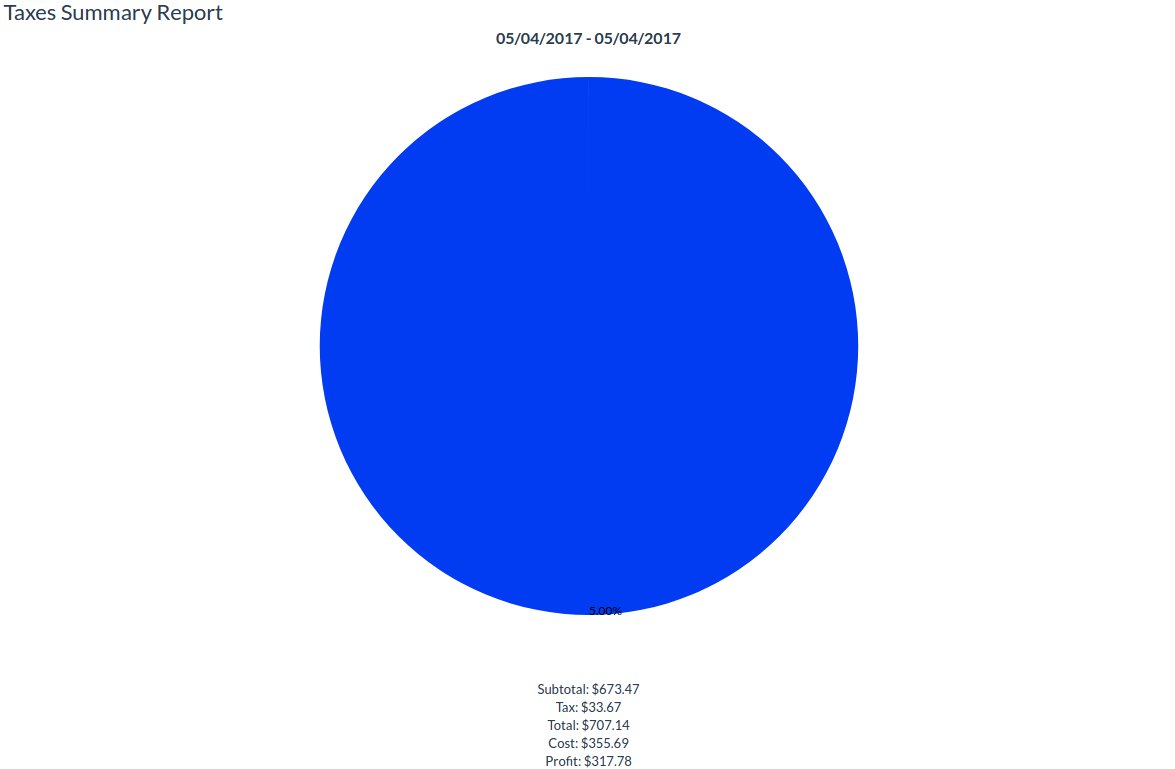
The Graphical Taxes Report shows you an overview of the taxes you've been collecting.
Discounts Report
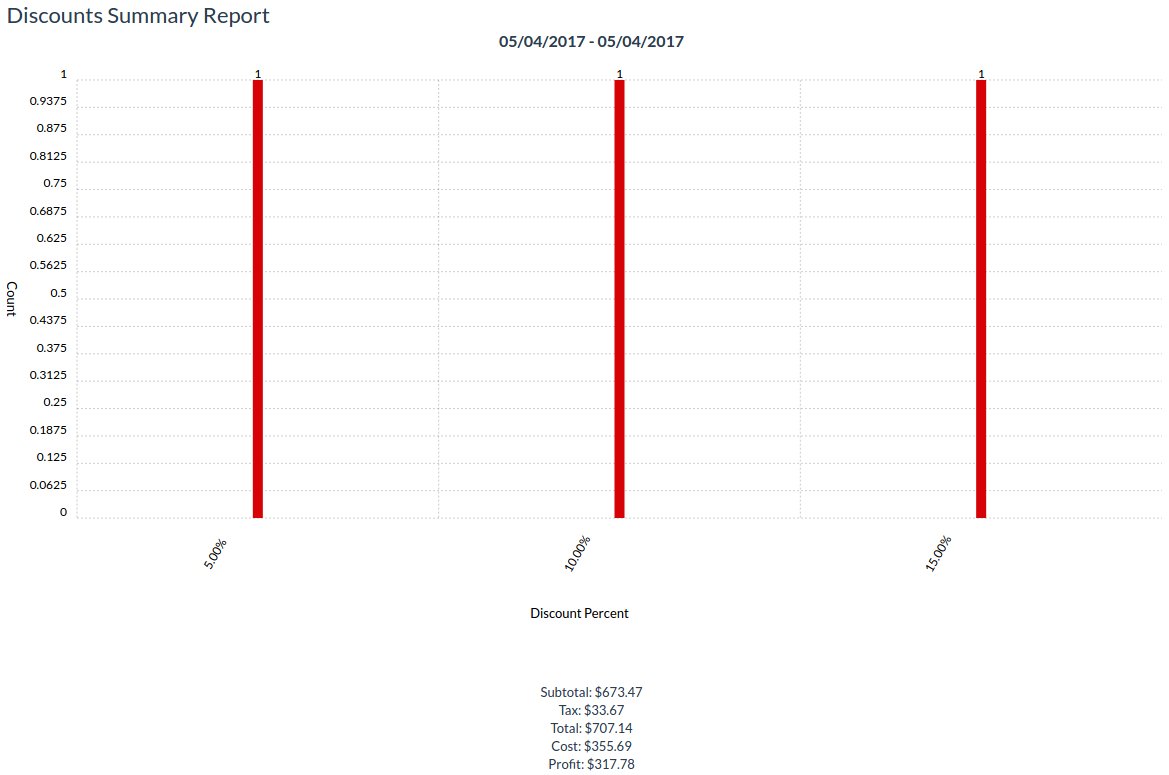
The Graphical Discounts Report gives you a bar chart of any discounts you've been giving. This lets you see at a glance how often you're discounting your products and what you're discounting them by.
Payments Report
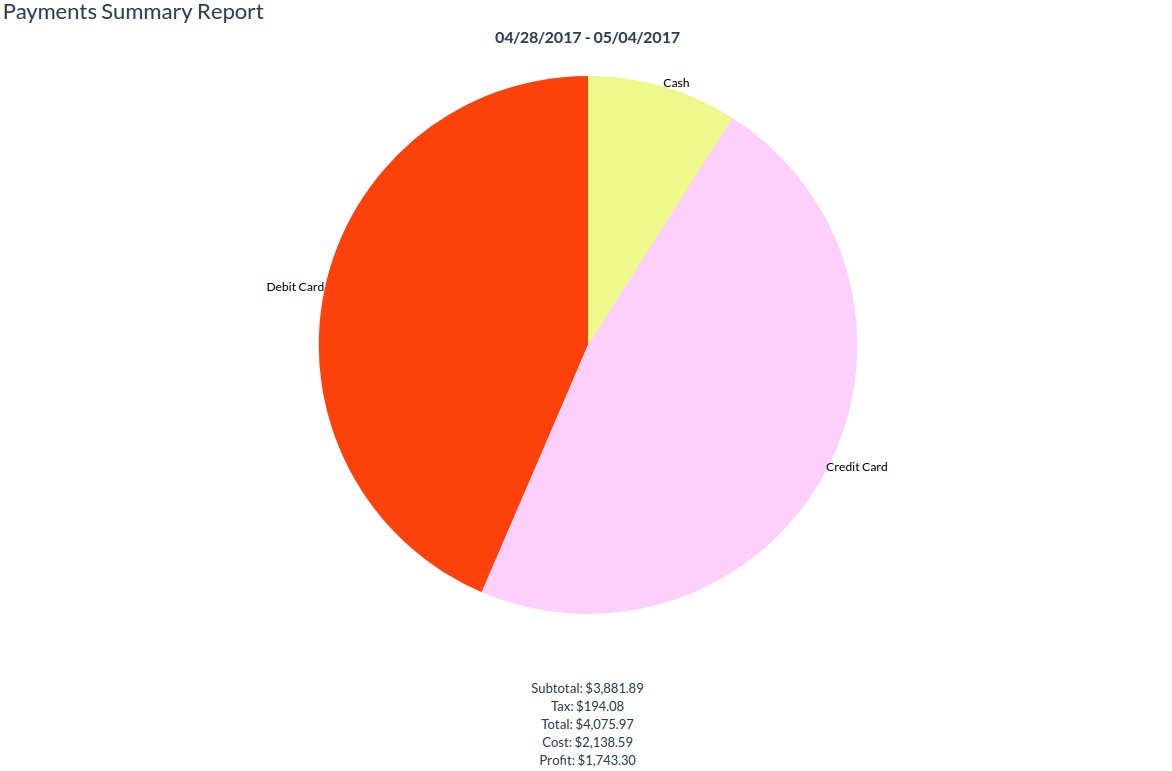
The Graphical Payments Report gives you a pie chart of payment types as a percentage of sales. This lets you see how the majority of your customers are paying you.